
Site News


It's been over a month...
It's been way too long since my last update. Here's some of the things we've added to the site over the past month or so:
- portfolio charts — investment, current portfolio value, and gain/loss over time, with or without comparisons against the KSE-100 index (paid users only)
- email a company's details — recent stock performance, last annual report's figures, recent company news — everything we show on the symbol summary page
- more derived data for the company fundamentals display (paid users only)
- one-click update of changed/delisted symbols on the portfolio and alert pages
- more technical screeners, including recent trades sorted by sector
- quick links for company fundamentals, sorted by EPS, ROE, P/E, P/BV (paid users only)
- interactive technical charts with over 50 technical indicators, buy/sell signals, and user-configurable parameters (paid users only)
- portfolio emails in text and csv format
- listed the various subscription packages as e-products on 2co
- pivot calculations, for rough indications of support/resistance levels (paid users only)
- calender selection for date fields
Curious about the interactive charts? Here's a screenshot of them in action (click for a larger image): 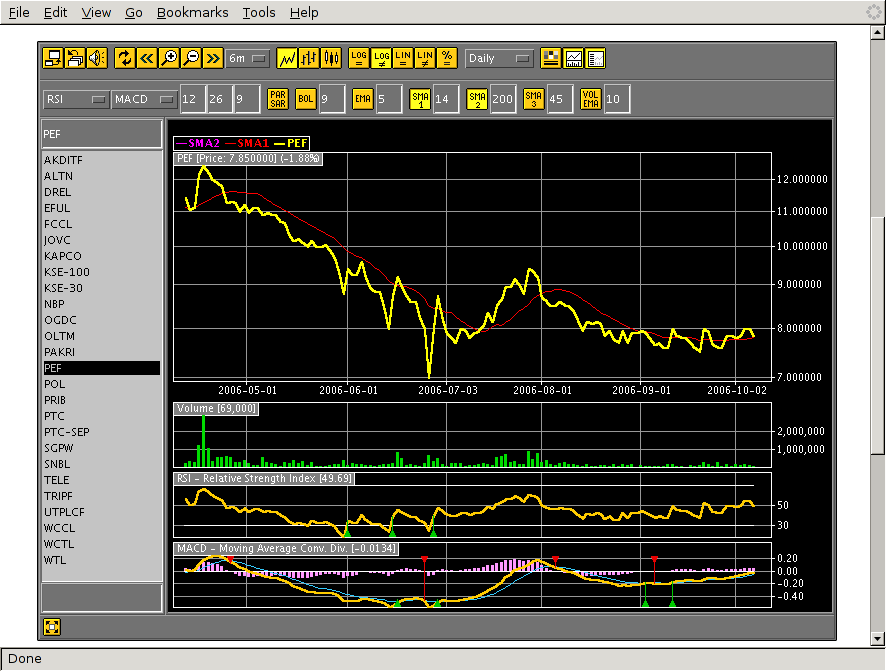
What's next? We're massaging some collected fundamentals data of quarterly announcements from 1997 onwards. It'll show up on the fundamentals page soon. We're also performing some backend optimization — automating the news subsite, for example. Most importantly, we're working to get a live KSE feed, for intraday charts and a stock ticker.
Several of the features I've listed up above were actually suggestions made by subscribers. If you'd like to see something on the site, let us know! We're more likely than not to add tools for our subscribers, and you don't have to be a paying subscriber for us to listen to you.
Hopefully my next update will be in less than a month's time...